


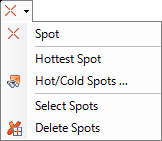
The spot  and connection
  tools allow to determine temperature at any point of the analyzed infrared image and show temperature difference between these points. IRT Cronista can also automatically mark the hottest and the coldest spots in the image.
The spot tool has several functions depicted below in this topic. First of all, it functions as an under cursor spot temperature flying tool and spot placement tool.
Under cursor spot temperature flying tool
Under cursor spot temperature flying tool is used to check the temperature at any place of the image. Activate the spot tool in the toolbar. The mouse pointer will change when it is over the active image to show that you have picked the spot tool  . Then move the mouse pointer over the image to read temperatures under the pointer and show them in a small window near the pointer (if in such a moment you make a click with the left mouse button, a new measurement object will appear on the image).
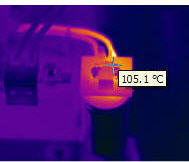
Spot placement tool
To place a measurement spot on the image: 1.Pick the spot tool from the toolkit 2.Place the pointer at the spot on the image where you want to measure the temperature and click. Now you have a new spot object on your image with the temperature indicated. |
Connection tool
The connection tool displays the difference in temperature readings between any two measurement objects (spots, lines or areas). Before using this tool you should already have at least two measurement objects drawn in the image.
To display temperature difference: 1.Select the connection tool from the toolkit 2.Move the pointer over a measurement object, click on it with the left mouse button and, holding it, drag the pointer towards the other measurement object that will be subtracted from the first one. A line is dragged out from the first spot to the pointer showing that you are making a link between two spots. 3.When the pointer is on the second object, release the mouse button to display the temperature difference between the tools. |

In the picture below, you see the measurement object A-B that displays temperature difference between spots A and B.
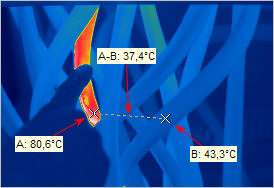
If two spots are connected, then their temperature difference is calculated. If lines or areas take part in the comparison, then their maximum temperatures are taken for calculation.
Select spots
This command contained in the spot tool submenu selects all spots in the active image (regular temperature spots, hot/cold spots, and temperature difference spots). After you have selected them, you can delete or move them altogether.
Delete spots
This command is also contained in the spot tool submenu. It erases all types of spots in the active image.