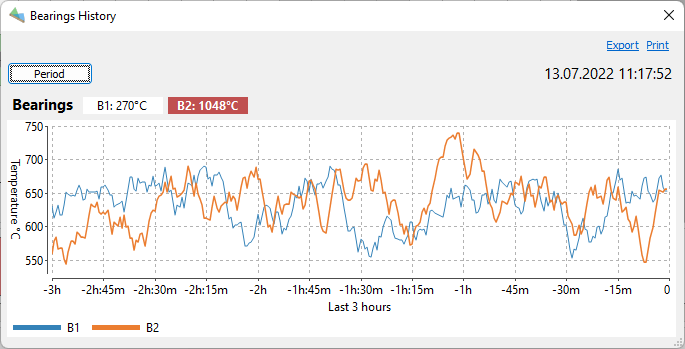
Current measurements of bearings (or other monitored objects) are displayed at the bottom of the monitoring window below the rotation information.

History trend
To see the data in a bigger window and to display the temperature trend, click on the More link. Same window is shown if to select Monitoring / Bearings History in the main menu (the name will be different if another name is set in the configuration).

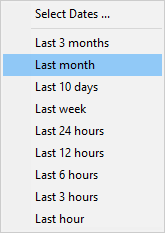
To select displayed history period press Period button:

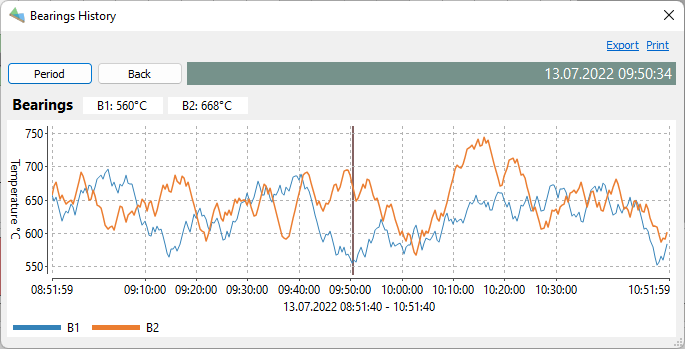
Click on the diagram to show the cursor. Diagram caption will change its color to gray-green, this means that it shows history data, not the actual data.

·Cursor position time is show in the diagram caption with the gray background.
·You can move cursor using the mouse. Also with the mouse you can drag the trend to move the displayed period.
·Use the mouse wheel to change the time scale and see smaller or bigger periods.


