


In infrared images color of every pixel depends on its temperature. IRT KilnMonitor has means to adjust this dependency to make visual appearance of the kiln shell image better and to intensify important details. To set relation between colors and temperature you need to define temperature range and select color palette.
To configure temperature scale use main menu Configuration / Temperature Scale:
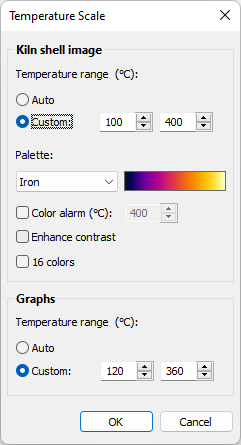
Kiln shell image temperature range
Temperature range defines visible temperatures of the image. Pixels with temperatures below the lower range limit are shown with the darkest palette color (color at the bottom of palette); pixels with temperatures above the upper range limit are shown with the brightest palette color (color at the top); pixels with temperatures in between have corresponding intermediate palette colors.
There are two possibilities that you can use to set temperature range:
1.Auto: IRT KilnMonitor calculates the best range automatically taking into account the current image histogram.
2.Custom: you can set your own range limits. This is useful when you are not interested in all temperatures present on the image but need a sub-range.
Palette
Palette is the set of colors that allows to see temperature differences. IRT KilnMonitor has a wide selection of color palettes that can be used to display infrared images. Sometimes one palette suits better to reveal the problem than the other.
Color alarm: pixels with temperatures above the selected value will be displayed with a contrast color. This contrast color depends on the used palette and cannot be user selected.
Enhance contrast: automatically distributes colors on the palette to improve image contrast.
16 colors: leaves only 16 colors on the palette.
Graphs temperature range
Defines vertical (Y) axis limits for the horizontal profile and for the temperature trend graphs. You can set the values or select the Auto option. With auto, IRT KilnMonitor will be adjusting the axis limits depending on the graph data values.