


The purpose of this function is to eliminate the effect of different emissivity values at different points on an object allowing temperatures measurements to be more accurate.
For example, this method may be applied for thermal analysis of circuit boards, that consist of parts with different emissivity values.
IRT Analyzer gives you the option to measure emissivity values at each image pixel, and then apply these measurements to other images to calculate their true temperatures. In order for this method to work, object position must stay precisely the same on the image emissivity map is calculated from and on the image emissivity map is applied to.
Theory
The intensity of infrared radiation coming from a point on an object is the sum of the radiation emitted by the object itself and the ambient radiation reflected by the object:
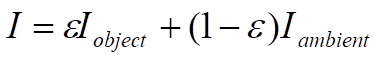
Where,
 is the intensity of radiation coming from the object.
 is the intensity of radiation coming from the object’s environment.
 is the emissivity of the surface of the object.
 is the intensity of detected radiation.
Note: The emissivity is in general a function of both the object temperature and the frequency of the radiation, but in practice, it is regarded, to a good approximation, as independent of these factors for the materials and temperatures that are likely to be encountered. We also assume that the contributions from atmospheric absorption and emission are insignificant.
Equation above shows that in order to calculate the true temperature at a point on an object from the detected intensity, you need to know the emissivity and the ambient temperature values at that point.
Emissivity map (one image method)
If to assume that the effect of the background is uniform across the whole surface of an object, to calculate emissivity map it is enough to have a single image with object heated to a known uniform temperature (this temperature must be different from the ambient temperature). The intensity of emitted radiation should be larger than the reflected ambient radiation, you should heat your object to a temperature higher than the ambient temperature.
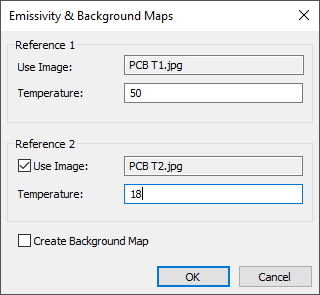
Emissivity and background map (two image method)
If effect of the background is not uniform and you want to compensate for it, you need to calculate both emissivity and background maps. For this you need to heat your object to two known uniform temperatures - first to T1 and then to T2 and calculate emissivity and background maps from the two infrared images. Temperatures T1 and T2 should be as distanced from each other as possible, this will allow more accurate results.
Emissivity map created using the two image method is more accurate than the map calculated from a single image. You can use the two image method also when you do not need background map.
Creating emissivity maps
To create an emissivity / background map:
1.Open one or two infrared images that contain your object heated to a know temperature.
2.In the main menu select 'Temperature/Save Emissivity Map'.
Background map can be only created when you have two images. Emissivity map can be calculated from one image, but calculations will be more accurate if to use the two image method.
If it is not possible to measure emissivity or ambient temperature at some pixels, IRT Analyzer will show you how many such pixels are there in percents.
After emissivity / background map is created and saved, it is loaded and applied to the source images for you to check the accuracy of the calculations.
Applying emissivity maps
To load a previously saved emissivity / background map, select 'Temperature/Load Emissivity Map' in the main menu. Loaded emissivity / background map will be applied to the active image.
Image(s) of the emissivity / background map will be displayed in the navigation panel in the 'Emissivity/Ambient Maps' dialog.
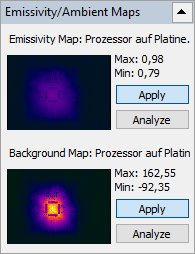
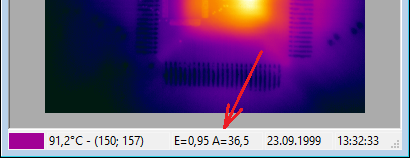
When maps are applied, to learn values for emissivity and ambient temperature at any pixel of the image, simply move the mouse cursor to that pixel. The values will be displayed in the status bar at the bottom of the image.
Analyzing emissivity maps
An emissivity or background map can be treated as an image and IRT Analyzer can open them as images. Use the usual 'File/Open' menu or press 'Analyze' button on the 'Emissivity/Ambient Maps' dialog.
With emissivity / background maps, you can do same operations as with normal infrared images, for example, you can apply analysis objects and create diagrams.