


IRT Analyzer can draw the following graphs:
1.Line profiles
2.Area histograms
Graphs described here use data only from one infrared image. There are also analysis trend graphs, which use data from a sequence of images. They are discussed later in this manual.
Line profiles
Line analysis objects in IRT Analyzer include segments (arbitrary, horizontal, vertical), polygonal lines and crossing lines. Line profile visualizes primary analysis information about a line. Line profile is a curve showing temperature values of every line point.
To show a line profile diagram, create an analysis line object and select main menu item 'Analysis | Analysis Graphs | Profile'.
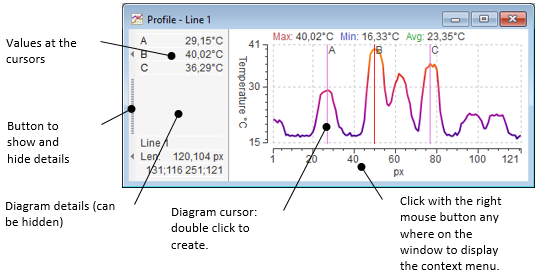
As you can see from the picture, a diagram window contains the diagram itself and a table with details. The details part can be hidden. It shows values at the diagram cursors and additional information about the line object. To change diagram appearance, use its context menu (click with the right mouse button on the diagram).
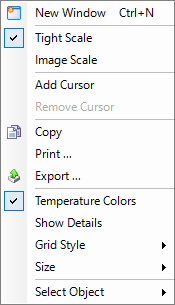
Here is what every menu item does:
·New Window: opens an additional diagram window of the same type (in this case an additional profile diagram). If you have two line objects, this new window will show a profile for the second line.
·Tight Scale: affects the temperature axis. When selected temperature axis limits will be the minimum and maximum values on the line.
·Image Scale: affects the temperature axis. When selected temperature axis limits are set to be the same as the image temperature range.
·Add Cursor/Remove Cursor: adds a new cursor to the diagram or removes the cursor you have clicked on.
·Copy: copies the diagram into the clipboard.
·Print: prints the diagram.
·Export: saves diagram data to a file in a variety of formats (picture formats, CSV, TXT, AVI video).
·Temperature Colors: when selected, diagram uses “temperature colors” to draw the curve. This means, color of every profile point depends on its value and is taken from the image palette. When 'Temperature Colors' mode is not active, all pixels have the same color.
·Show Details: shows and hides the details part of the window.
·Grid Style: diagram draws lines from axes ticks, which create a grid. In this menu, you can delete these lines or choose their visual style.
·Size: there is a selection of three sizes – small, normal and large. Choose the one which better fits your screen resolution and preferences.
·Select Object: allows you to select another line object to be shown in the diagram.
Area histograms
Area histogram is a diagram showing temperature distribution in an area. In other words, for any temperature range, you can see the percentage of pixels falling into this range.
To show an area histogram diagram, create an analysis area object and select main menu item 'Analysis | Analysis Graphs | Histogram'.
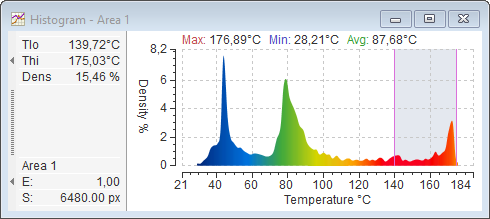
As you can see on the picture, histogram window looks similar to the profile window. Same as for a profile window, using histogram's context menu you can create diagram cursor, hide, and show the details part, size the window, select the grid style, copy and export diagram data, change axes scale and select which area object to use.
Only one cursor is allowed for a histogram. Histogram cursor defines a temperature range, its parameters are shown in the details part:
·Tlo – cursor's lower limit.
·Thi – cursor's upper limit.
·Dens (density) – the percentage of pixels falling into the cursor range.
·E – emissivity of the object.
·S – area of the object.
Box envelope profiles
To create an envelope profile is a rectangular area is needed. Envelope profile consists of two curves: the upper curve shows the maximum value for every vertical (horizontal) line of a rectangle, the lower shows the minimum.
To show a box envelope profile diagram, create a rectangular analysis area object and select main menu item 'Analysis | Analysis Graphs | Box Envelope Profile'.
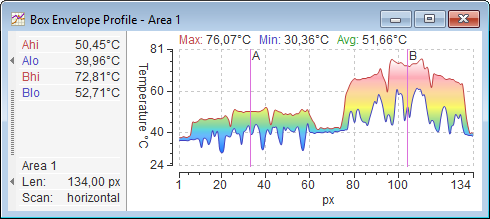
You can add several cursors to it and their values will be shown in the details part.
By default, the rectangle is scanned from left to right (horizontal scan). You can change this to the vertical scan and the object will be scanned from top to bottom. To do so, choose 'Vertical Scan' in the context menu of the diagram window.