


Graphs described in the previous topic needed only a single infrared image. Trends are different - they take data from a sequence of images and display how temperature is changing with the time.
Analysis trends are primarily designed to analyze prerecorded sequences of images. But it is also possible to use analysis trends with live image. In this case frames from the acquisition history buffer are used to build the graph. Acquisition history buffer length is limited, so analysis trends length is also limited. With live image we recommend using real-time trends, they are specially designed for real-time and can be much longer in time.
IRT Analyzer can build the following trends:
1.Point trend
2.Area trend
3.Mixed trend
4.Profile trend envelope
5.Box line trend
Point trend
Point trend shows a spot temperature value change over time. Curves of up to 6 spots can be displayed on one trend diagram.
To show point trend, create spot objects and select main menu item 'Analysis | Analysis Graphs | Point Trend'.
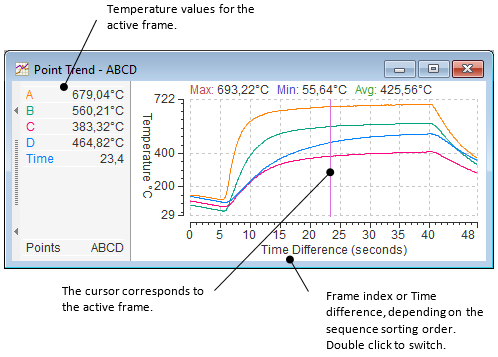
In order to avoid dependency on the pixel noise, consider applying averaging to the points. |
To add and to remove points from the trend select 'Select Points' in the context menu of the point trend window.
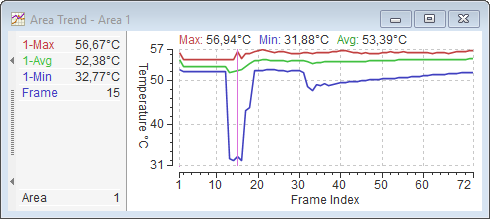
Area trend
An area trend can be built by an area or a line object. It shows the minimum, maximum and average temperature in this area for every frame in the sequence. Only one area or line object can be used to build this trend.
To show area trend, create area or line objects and select main menu item 'Analysis | Analysis Graphs | Area Trend'.
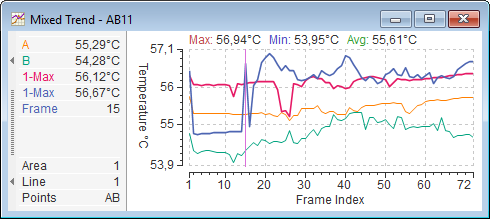
Mixed trend
Mixed trend can show point trend curves and area trend curves on the same diagram.
To show mixed trend, create needed analysis objects and select main menu item 'Analysis | Analysis Graphs | Mixed Trend'.
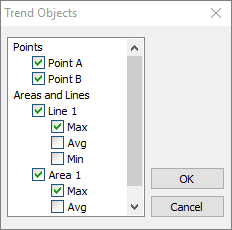
Mark objects and properties you want to see in the trend in 'Trend Objects' dialog.
Profile trend envelope
A profile trend envelope shows aggregated minimum, maximum and average line profile of all frames in a sequence. In other words: for every point of a line IRT Analyzer calculates minimum, maximum, and average values among all frames in a sequence. So, it is not really a trend as it does not have time axis.
To show profile trend envelope, create needed analysis objects and select main menu item 'Analysis | Analysis Graphs | Profile Trend Envelope'.
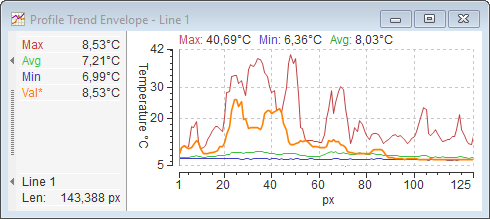
·The red curve shows the aggregated maximum profile.
·The blue curve shows the aggregated minimum profile.
·The green curve shows the aggregated average profile.
·The orange curve shows the profile of the active frame.
Box line trend
Box line trend is a box envelope profile generalization for the case of many images. A box line trend shows minimum, maximum, and average temperature value for each vertical (horizontal) line of a rectangle, taken from all frames in a sequence.
Box-line trend needs a rectangular area object. To show box line trend, create a rectangle area object and select main menu item 'Analysis | Analysis Graphs | Box Line Trend'.
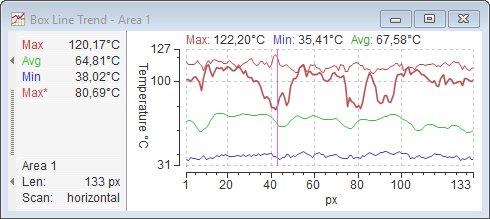
You can also show box envelope profile values of the active frame. In the context menu choose 'Frame Max', 'Frame Min' or 'Frame Average'.