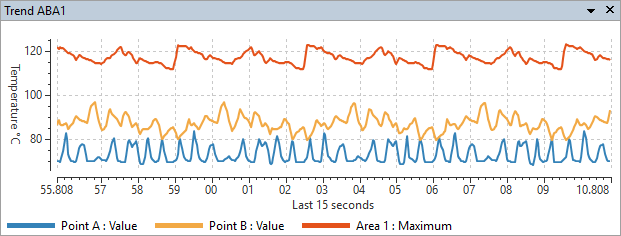
Like analysis trends real-time trends display how temperature of some object is changing with the time. Real-time trends are created by live image from a camera: every frame in the live video stream adds data to the real-time trend.
Real-time trends can be built by the following objects and their values:
·Points: value.
·Lines: minimum, maximum, and average temperature values, deviation.
·Areas: minimum, maximum, and average temperature values, deviation, standard deviation, object area, object relative area.
·Image metadata.
You can create several real-time trend windows. To create a trend: start image acquisition, create analysis objects you want to see in the trend and click 'Analysis | Real-time Trend' in the main menu (or  button in the toolbar).
You will see a dialog with a list of measurements available for building a trend:
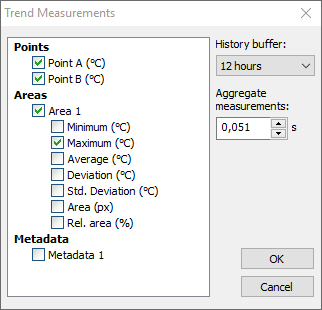
'History buffer': defines period trend data is kept for. Older records are deleted.
'Aggregate measurements': defines time interval for one trend record (trend data resolution). If there are more than one image frame coming during this time interval, measurements are aggregated into one record and then this record is added to the trend.
Trend data is kept in the memory, its length cannot be infinite. There are three parameters that define the size of memory buffer needed for a trend:
1.Number of measurements
2.Data frequency
3.History period
When you mark measurements in the list, you define the number of measurements; 'Aggregate measurements' time defines data frequency; history time is defined by 'History buffer'. Memory buffer reserved for each trend cannot exceed 64 MB. When you increase one parameter, IRT Analyzer may decrease other parameters to keep trend memory buffer in the allowed limit.
Let's assume that the camera is running at 60 Hz. This produces 60 trend records every second. Time interval for one record is 1 second / 60 = 0.0167 seconds. If you set aggregate interval to 0.016 seconds or to a smaller value, all records will be written to the trend. If to a bigger value, some records will be aggregated together into a single record and then this single record will be written to the trend.
If you need keep old records for, let's say, 1 week, you will not have enough memory if aggregate interval is 0.016 seconds. You need to sacrifice trend resolution and set aggregation interval to a bigger value (IRT Analyzer does it automatically for you).
Methods used to aggregate measurements: ·Point values: maximum. ·Line/area maximum values: maximum. ·Line/area minimum values: minimum. ·Line/area average values: mean. ·For all other measurements maximum is used. |
Set 'Aggregate measurements' to 0.001 s to write all records to the trend without aggregation. |
Trend display mode
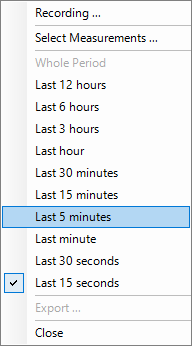
When acquisition is running, trend graph is scrolled automatically to always show the most recent measurements. You can change the displayed period length in the context menu of the trend window:
When acquisition is stopped or put on hold, trend automatically switches to the free navigation mode:
·Using the mouse, you can drag trend graph left or right to see older/newer records.
·You can change trend scale (zoom in/out) using the mouse wheel.
·By clicking on trend graph, you can set trend cursor to show corresponding infrared image (image will be shown only if it is present in the acquisition history buffer).
Recording trend to a file
To start trend recording to a file select 'Recording' in the context menu of trend window.
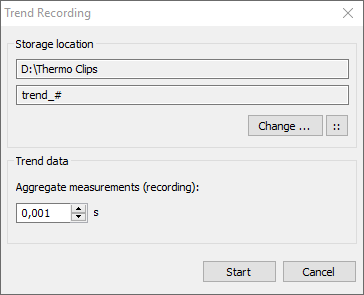
You need to specify trend file location. It works the same as setting location for recording images.
Then you need to specify 'Aggregate measurements' interval, which can be different to the interval selected for the trend in the memory and will affect the size of recorded file.
Click 'Start' to start recording to a file. Only new records will be recorded. Trend data recorded to the memory before Start is pressed will not be saved to the file.
To stop trend recording, select 'Stop Recording' in the trend context menu.
Trend is saved in a proprietary format. After trend is recorded, you can load it back to IRT Analyzer and convert it to CSV or Text format using 'Export' command in the context menu. Export command is available when acquisition is not running or put on hold. Unlike trend recording, export saves only the trend data currently in the memory. |
Loading trend from disk
Recorded trend can be opened in IRT Analyzer with the usual 'File | Open' command.
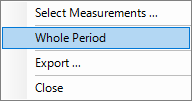
Trend is opened in the free navigation mode, so you can use the mouse to move and zoom the trend. To return to the whole trend period, select the corresponding item in the context menu: