


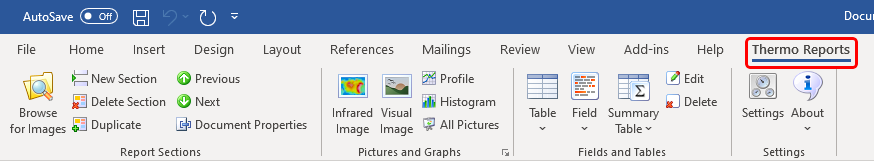
For you to be able to edit generated reports and to create new templates IRT Analyzer adds Thermo Reports toolbar to Microsoft Word.
If you cannot find Thermo Reports toolbar in your Word, please see Troubleshooting reporting problems.
Report Sections
Sections are used to separate report header/footer pages from the pages with images and inspection data imported from IRT Analyzer.
·'Browse for Images': opens IRT Analyzer so you can select IR image to fill current section if it is empty. If current section is not empty, this command opens IR image stored in the section for editing. See Editing generated reports for details. |
·'New Section': adds a new section to the document. Sections are used to separate IR images and to link them with graphs and tables. In templates, section with an IR image placeholder defines document part that is duplicated for every reported image. |
·'Delete Section': deletes the current section. |
·'Duplicate': creates a new section (page) at the current position and copies section layout from the previous section. Use this command to insert new image and inspection data. |
·'Previous/Next': jumps to the previous or to the next section in the document. |
·'Document Properties': displays a dialog to change values of the document properties. |
Pictures and Graphs
With the help of Pictures and Graphs group you can create picture placeholders. Placeholders are special objects that mark places in the document where infrared or visual images, profiles or histograms will be placed.
·'Infrared Image': inserts infrared image placeholder at the current position. Double click on the inserted picture to load data to it. If used in a template, report generator will replace this placeholder by an infrared image. |
·'Visual Image': inserts a visual image placeholder at the current position. |
·'Profile': inserts a profile graph placeholder. Graph will be drawn only when the source infrared image contains line objects. Second profile placeholder in the same section will use the second line object from the image. |
·'Histogram': inserts a histogram graph placeholder. Graph will be drawn only when the source infrared image contains area objects. Second histogram placeholder in the same section will use the second area from the image. |
·'All Pictures': allows to insert other placeholders supported by IRT Analyzer (not all available placeholders have buttons in the toolbar). |
Fields and Tables
Fields and Tables are similar to placeholders, only they are replaced not with pictures but with text information.
·'Image Info': inserts a table which is automatically filled with infrared image properties information. You can select what data will be show in the table. |
·'Analysis Info': inserts a table which is automatically filled with data taken from analysis objects (e.g. spot temperature values). You can select what data will be show in the table. |
·'Notations': inserts a table which is automatically filled with notations (not supported by IRT Analyzer). You can select what data will be show in the table. |
·'Insert Field': inserts a text field which will be replaced by a text value (image date, temperature at a spot, formula result, etc.). |
·'Insert Document Property Field': inserts a document property field - a text field that takes its value from the Document Properties. |
·'Formulas': displays formulas stored in the document. Formulas are mathematical calculations based on infrared image measurements. |
·'Link Notations': by linking a notations set, you will be able to insert image notations from this set as Fields and Tables. |
·'Insert Summary Table': inserts a summary table. Summary table shows information about all measurements in the report (one row per each IR image). |
·'Update Summary Table': updates contents of a summary table. When you add new data to the report or modify some data the summary table is not updated automatically, you need to update it by pressing this button. |
·'Edit': changes properties of the active report element (placeholder, field or table). |
·'Delete': deletes active report element (placeholder, field or table). |
Settings
'Settings': allows to select general properties of the report document: type of section breaks (page or continuous), imported pictures format parameters (like image quality optimization - screen or printing) and some parameters for drawing diagrams. |
'About': gives information about the company and the product. |