The area tool can be used to place an area object (rectangle, ellipse or polygon) on the image.
You can use areas on the image for several purposes:
§to display the maximum, minimum and average temperature within this area;
§to display the temperature distribution (histogram) in this area.
To draw an area on the image: 1.Pick an area sub-tool from the toolbar by clicking on the small rectangle near the area tool button and choose the type of the area that you need. The mouse pointer will change to 2.Position the pointer where you want the upper-left corner of the area to begin and press the left mouse button to start creating area object. Then, holding the button, drag the pointer to the position where you want the right bottom corner to be (or to place the next joint point in the case of polygon) and release the button. In case of a polygon, consequently click in the image on places where you want to create vertices. 3.To complete polygon creation and to be able to place other objects, click on any tool in the toolbar (or right click anywhere). |

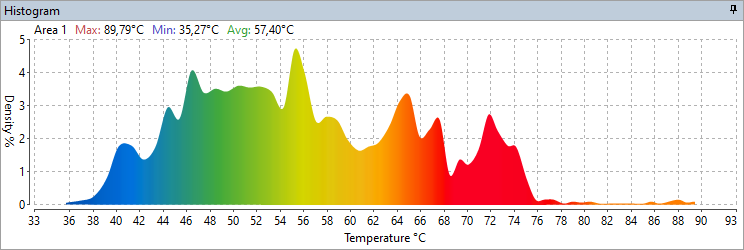
When you create an area object, IRT Cronista automatically draws its histogram and shows it in the diagram window at the screen bottom.
Area histogram presents more thermal information about an area. Histogram is a diagram showing temperature distribution in an area. In other words, for every temperature you can see how many pixels fall into this range.
Hint: The histogram section is a part of the Analysis Details window. So, if you have drawn an area and still do not see its histogram, this is probably because the Analysis Details window is not shown. To show this window, choose Analysis Details from View | Windows menu. |
If you place more than one area on the image, histograms for all of them will be drawn in the same window with different colors:
Histogram of the active area is always drawn in the foreground in red color. Additional statistical values like minimum or maximum refer only to the active area.
Notes: §Though, all histograms are displayed in the same window on the screen, it can be different in a report: place two placeholders for histograms in the report template. In this case your report will contain two separate histogram diagrams. §Using the context menu of the histograms window (right-click on the window), you can copy the diagram into the clipboard or change properties of the linked area object. |