The line tool can be used to draw a line or a polyline (a series of lines joined end to end) on the image.
You can use lines in several ways:
§to display the maximum, minimum and average temperature along the line (or polyline) in the image;
§to display the temperature profile along a line (or polyline) in the image.
To draw a line or a polyline on the image: 1.Pick a line sub-tool from the toolbar by clicking on the small rectangle near the line tool button and choosing the type of the line that you need (free line, horizontal line, vertical line or polyline). The mouse pointer will change to 2.Position the pointer where you want the line to begin and press the left mouse button to place the first of line's end-points. Then, holding the button, drag the pointer to the position where you want to place the next (or the last) point and release the button. In case of a polyline, consequently click on places where you want to create new vertices. 3.To complete polyline creation and be able to place other objects, click on any tool in the toolkit (or click anywhere with the right mouse button). |

When you create a line measurement object, IRT Cronista automatically draws the corresponding line profile in the profile window at the screen bottom. A profile is a curve showing temperatures at every point along a line.
Hint: The profile section is a part of the Analysis Details window. So, if you have drawn a line or polyline and still do not see its profile on the screen, this is probably because the Analysis Details window is not shown. To show this window, choose Analysis Details from View | Windows menu. |
If you place more than one line on the image, profiles for all of them will be drawn in the same window:
Profile of the active line is always drawn with a bold pen. Additional statistics like minimum or maximum refer only to the active line.
Notes: §Though, all profiles are displayed in the same window on the screen, it can be different in a report: place two placeholders for profiles in the report template. In this case your report will have two separate profile diagrams. §Using the context menu of the profile window (right-click on the window), you can copy the diagram into the clipboard or change properties of the linked line object. |
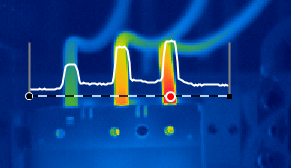
On-image profile
The line profile can be displayed directly on the image. Right-click on a line object and select On-Image Profile from the context menu.