


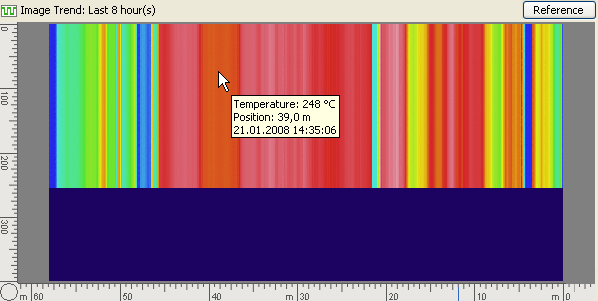
Image trend is a thermal image composed from many kiln shell images taken from the history. Every horizontal line represents one image, it consists of maximum column temperatures along the X-axis. The X-axis corresponds to the kiln X-axis.
To show the Image trend, choose Reference / Image Trend and select a history type: short-, middle- or long-term. The operation of processing history data and building the image trend may take some time.
The number of lines in the trend image is equal to the height of the kiln shell image, but it cannot bigger than the number of kiln states that can be possibly saved in the history database (usually 400, can be changed in Linescano.ini). |
The most recent data is placed at the top. When new data is added to the history, Image trend is automatically updated – new data occupies the first (upper) line, and the rest descends one line down.
The Trend image caption shows what period of time is displayed (e.g. Last 17 hours, Last 6 months, etc.).
When you move the mouse cursor over the trend image, line and spot information is displayed in the small window.
The context menu allows to zoom in and out the image. You can also do it using the mouse wheel.
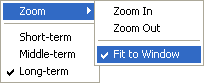
Image trend is also available in History Tabs.