


IRT KilnMonitor can continuously monitor selected areas of the kiln shell and display trend graphs for them.
To start trend monitoring, follow the steps:
1.Switch to the Temperature map 2D view.
2.Place analysis objects on the areas which you want to monitor in the trend. All analysis objects can be monitored: spots, lines, areas, slices and intervals. See Analysis objects to learn more about analysis objects).
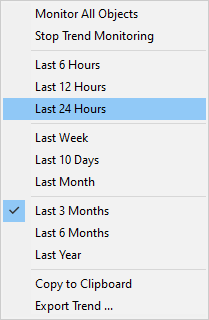
3.In the main menu select Trend / Monitor All Objects.
All analysis objects will be added to the trend and IRT KilnMonitor will start gathering data for these objects. After each kiln rotation new data will be added to the trend. At the same time, IRT KilnMonitor will start to load images from the kiln history and will update trend with historical values.
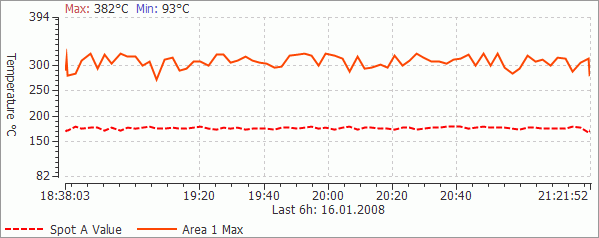
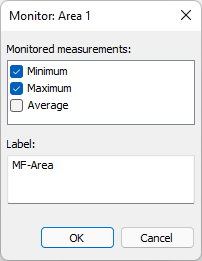
By default, only the maximum temperature of every object is monitored. But it is also possible to monitor the minimum and the average temperatures. To set this, click with the right mouse button on an analysis object and select Monitor command. In the object monitoring dialog, set the properties you want to monitor in addition. Here it is also possible to set monitoring label. This label is used in the monitored measurements part of the monitoring report.
Monitor command in the context menu can also be used when you do not want to monitor all the objects and want to select yourself which objects to monitor.
Notes When an analysis object is monitored in the trend, it is not possible to move it or to change its size and parameters. When an object is monitored, it is also added to the monitoring database and can be displayed in reports. You can change the Y-axis limits in the Temperature scale and palette dialog. |
Trend period
You can select displayed trend period. You may choose periods from Last 6 hours to Last Year. Select the corresponding command in the main menu Trend or in the trend window context menu.
Exporting trend data
Trend data can be exported to a CSV/TXT/PNG/JPEG file. To do this, right click on the trend diagram window and select Export in the context menu.
Trend in the kiln history view
You can display temperature trend in the history view. Trend period will be the same as the selected history period. It is also convenient to use the cursor on the trend to navigate through kiln history.
1.Open the History tab and load the history data for some period of time (see Kiln history).
2.Place analysis objects.
3.In the main menu select Trend / Monitor All Objects.
IRT KilnMonitor will automatically load all images from the selected history period and will update trend with data from them.