The Temperature Map 2D view represents a plane two-dimensional infrared image of the kiln.
The axes show the real kiln shell coordinates. The X-axis is the kiln axis; Y-axis is the angle measured in the direction opposite to the kiln rotation. 0 of the Y-axis corresponds to the kiln trigger position.
The 2D infrared image is updated after each kiln revolution.
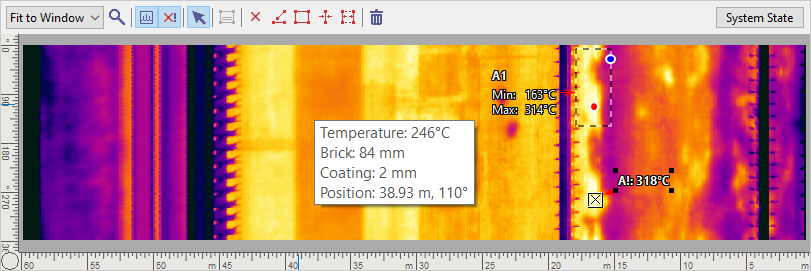
When the mouse pointer is moved over the infrared image, an info window is displayed showing the temperature and coordinates of the spot under the pointer; brick and coating thickness values are also displayed if they are available.
The temperature Map 2D can be displayed at the top or bottom part of the screen (when combined with one of the 3D views).
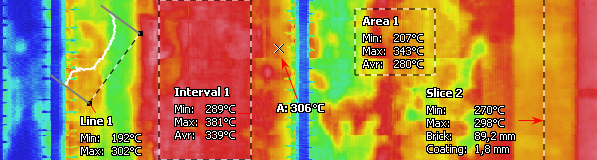
Analysis objects
The Temperature Map 2D view allows creating measurement objects on the infrared image. Here you can perform thermal analysis of the infrared image of the kiln shell: measure spot temperatures, create temperature marks, get statistical information on lines and areas, etc.
The Temperature Map 2D view has its local toolbar with all the measurement tools that can help you to analyze the infrared image:

|
Zoom tool |
Allows to scale the image. Pick up the zoom tool and click on any area of the image to increase it. Use the right mouse button to restore the normal image size (corresponds to Fit to Window command in the Zoom combo box). You can also use the mouse wheel to control the zoom. When the zoom factor is adjusted so that not the whole image is visible, a rectangle appears in the kiln design view showing the location of the visible area on the shell. |
|
Selection tool |
Selects, moves and resizes analysis objects. It is also used as the flying spot temperature meter to check the temperature under the mouse pointer. With the help of the selection tool you can move and reshape objects and their labels. Hint: to switch to the Selection tool after using another tool, just right-click on the image. Double-click on any place on the image to open the brick or shadow zone information window. |
|
Suppress alarm tool |
Allows to mark rectangular areas on the kiln shell image that will be excluded from alarm tests. See Alarms suppression topic. |
|
Spot tool |
Creates an analysis spot object on the image. The default label of the spot object shows only the temperature at this spot. However it can also display the brick and coating thickness values at this spot. To choose which parameters to show on the label, right-click on the spot object and select Label in the context menu. |
|
Hot spot tool |
Shows or hides the hottest spot on the kiln shell image. |
|
Line tool |
Creates an analysis line object. You can draw a straight line in any direction (horizontal, vertical, diagonal). The line label displays maximum and minimum temperature along the line. Brick and coating thickness is not available for lines. In line's context menu you can choose to show On-Image Profile that will display the distribution of temperatures along the line. |
|
Area tool |
Creates a analysis rectangle object on the image. The default parameters of a rectangle object are the minimum and maximum kiln shell temperature in this area. Using the Label dialog the minimum brick thickness and the maximum coating thickness can be displayed as well. The area object has an additional command in its context menu - Zoom Area. This command shows image part taken by the area in a separate window with increased zoom factor. |
|
Slice tool |
Makes a vertical slice of the kiln shell at the selected position. The slice object represents one vertical line of the image. Parameters of the slice object are the same as of area objects. In addition you can display the position of the slice in the label. As lines, slices can have on-image profile. Additional command in the context menu: Make 3D Section Here. This command opens the 3D Kiln Section view combined with the Temperature Map view, and the section position is set to the slice position. |
|
Interval tool |
Creates an analysis interval object. The interval objects is a special case of the rectangle object, so it has the same parameter and functionality. The difference is that interval objects always cover the entire height of the image. |
|
Delete button |
Deletes the selected object. To select an analysis object, use the selection tool. To delete all analysis objects at once, choose Analysis / Delete All Objects. |


The picture below presents all the above-mentioned analysis objects.
When the Temperature Map view is activated, it is possible to perform trend monitoring of any object. See the topic Temperature Trend for details.
Objects' labels
Labels can show object properties. To see what properties are available on each type of measurement object, right-click on the object and select Label in the context menu. In the Label dialog you can adjust different settings for labels and add any custom text to them.
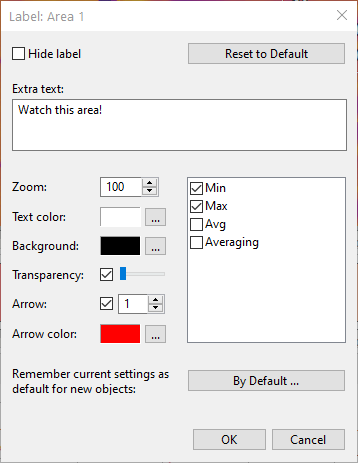
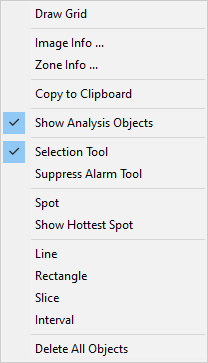
Image context menu
The infrared image of the kiln shell has its own context menu that contains all set of analysis tools described above as well as some additional commands.
·Image Info opens a dialog with image information such as image size, date and time image was created, calibration range. These properties are read only.
·Zone Info shows brick and shadow zone information for the zone at the mouse pointer position (place where you clicked with the right mouse button to display the context menu).
·Draw Grid shows or hides the coordinates grid on the infrared image.