


To open the Monitoring window from the start-up screen, press Monitor button or select Monitoring / Open Monitoring Window in the main menu (using the menu will open the monitoring window without starting kiln monitoring).
Start / Stop Kiln Monitoring
Use Start and Stop buttons in the toolbar (
 ) to start or stop monitoring of the selected kiln. To select a kiln, click on the corresponding tab at the top of the monitoring window.
Views
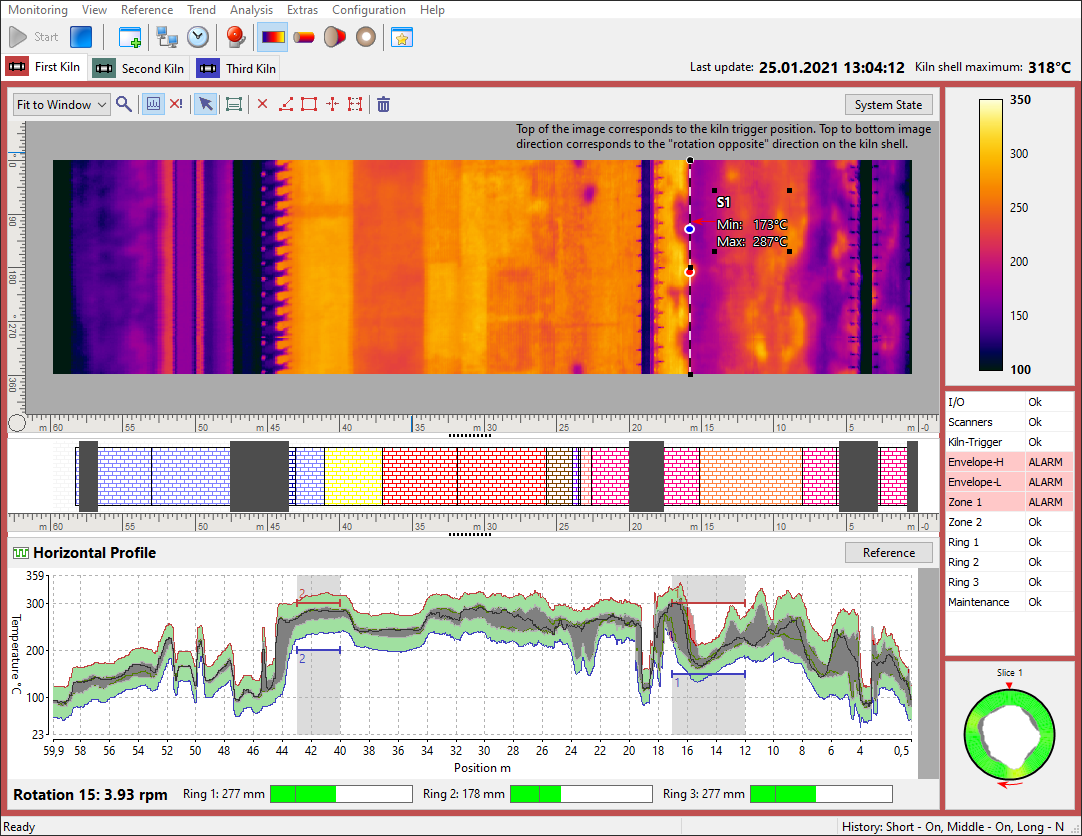
Monitoring window is divided into three parts: the main view (top), the reference view (bottom) and the side view.
Main view can display:
·Temperature map (infrared image of the kiln shell);
·3D virtual kiln;
·3D kiln section;
·3D end-view.
Reference view can contain:
·Horizontal profile;
·Temperature trend;
·Image trend;
·History reference.
Side view displays:
·Temperature scale;
·Alarms status window;
·Burning zone view;
·Rotation / Tire slip trend;
·Thickness / Coating diagram.
Kiln state update time and the maximum kiln shell temperature is displayed in the top-right corner of the monitoring window.

At the bottom of the window, kiln rotation counter, rotation speed (rpm – rotations per minute) and tire slip information is displayed.

The main menu and the toolbar of the monitoring window is dynamic, their contents depend on the active view mode and on the type of data source (server or client).
Data sources
Monitoring window can receive the data it displays from different sources. If the screen is running on IRT KilnMonitor server it is getting data directly from the kiln monitoring instruments. On a IRT KilnMonitor client, the data is received from the server through the network. History database can also serve as a data source.
Tabs at the top of the measurement window correspond to the data sources - each data source has its own tab. There are three types of data sources:
1.Local: data source for a kiln monitored directly by this computer.
2.Remote: data source for a kiln monitored remotely by another computer in the network.
3.History: data source that gets data from the history database of a kiln.

·Red light on the tab informs about an alarm.
·Green means everything is OK.
·Blue light indicates a hardware breakdown. The breakdown details can be found in the System State window.
All tabs contain the name of the kiln they refer to. Besides, remotely monitored kiln tabs contain server computer name. Data from the history storage is accompanied with the time information.
Status Bar
The status bar contains specific information depending on the selected tab (e.g. next history recording time, remote server status, date and time of the current history frame, etc.).
·For local data sources the left cell of the status bar indicates whether short-term and middle-term history is on or off, and the next long-term recording time if it is enabled (see Configuring history storage).
·For history data sources the status bar shows the date and the time of the current history frame.
·For remote data sources the status bar indicates the monitoring server status (running, stopped, connection lost, server is shut down) and the last data update time.