


System state window displays detailed information about the kiln monitoring system and its hardware. It has several tabs. Active tab is marked by the blue color. If a tab has information about an error, this tab is marked with the red color.
Scanners and Pyrometers tabs are available only for the actual kiln state on IRT KilnMonitor server. For kiln states loaded from the history and for kiln states received remotely by IRT KilnMonitor clients these tabs are not available.
System state window will automatically pop out in case of a problem.
 You can also open this window using main menu View / System State or corresponding button on the measurement screen.
System tab
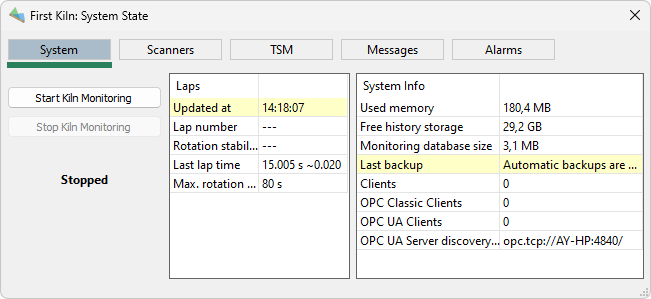
On this tab you will find the commands needed to start and stop kiln monitoring. It also shows:
·Updated at: the time the kiln state was updated at.
·Lap number: the number of laps (kiln revolutions) registered since kiln monitoring started. The number with tilde is the lap time variation measured on several recent rotations (see The kiln trigger).
·Rotation stability: if kiln rotation speed is stable or not.
·Last lap time: the time duration of the last lap.
·Max. rotation time: maximum expected time for one kiln revolution (from the kiln configuration).
·Used memory: RAM memory occupied by the program (it should stay relatively stable from the program start and day after day).
·Free history storage: the disk space available for history storage. If there is no disk space left, IRT KilnMonitor will not be able to save new kiln states to the history storage.
·Monitoring database size: the size that the monitoring database occupies on the hard drive.
·Last backup: date and time of the last successful backup.
·Clients: the number of IRT KilnMonitor clients currently connected to this server.
·OPC Classic Clients: the number of OPC DA clients currently connected.
·OPC UA Clients: the number of OPC UA clients currently connected.
·OPC UA Server discovery URL: the URL that should be used by an OPC UA client to connect to IRT KilnMonitor OPC UA server.
Scanners tab
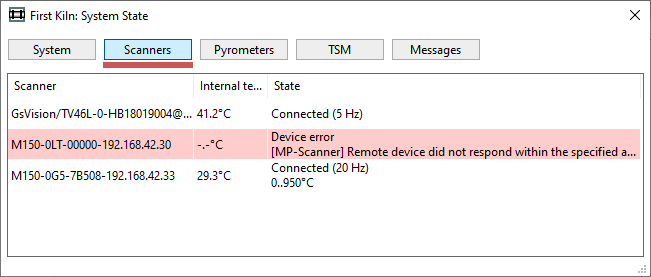
This tab shows information on the scanners configured to work with the system. This information includes device ids assigned to scanners in the configuration, internal temperature of each scanner, line scanning frequency and, in case of a problem, the problem text.
The information shown is updated every second. If communication is interrupted the information will be updated as soon as detection takes place.
Pyrometers tab
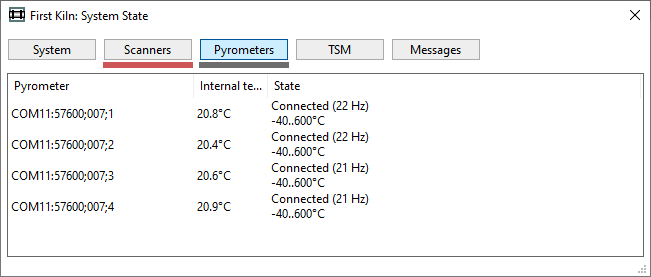
Similar as for the scanners, this tab shows information on the pyrometers configured in the system.
Tire slip monitoring tab
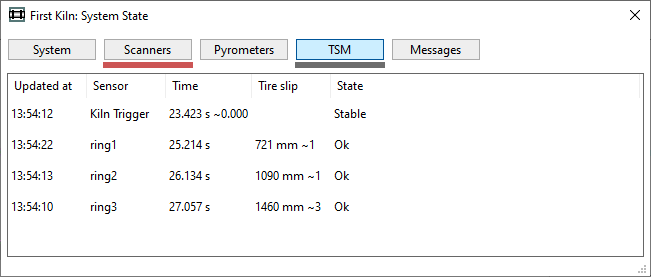
This tab shows information related to the TSM system (Tire Slip Monitoring).
Updated at: time when corresponding parameter was last updated. Tire slip values may not be updated after every kiln revolutions, for example, in case kiln speed is not constant. See Tire slip monitoring for details.
Sensor: name of the sensor (kiln trigger or ring name).
Time: last measured lap time (with time variation for the kiln trigger).
Tire slip: calculated tire slip and its variation (the number with tilde). Tire slip value is averaged from several revolutions, see Tire slip monitoring for details.
State: for kiln trigger possible states are: Measuring rotation stability, Stable, Rotation is not stable. For rings: Gathering data, Ok, No signal from ring sensor, Update timeout, Non uniform.
The numbers with tilde is the variation measured on several recent rotations (lap time variation for the kiln trigger and tire slip variation for rings).
Messages tab
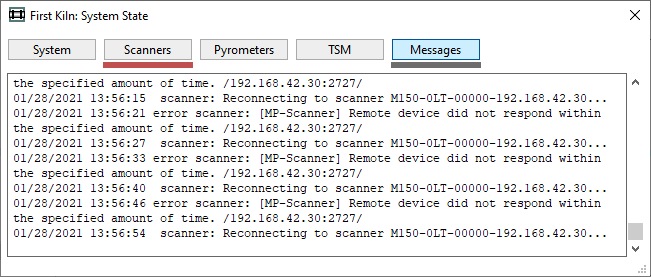
This tab displays all messages from the system. These message can be just informative, like that monitoring was started and also messages reporting about problems. All these messages make up the events log.
Alarms tab
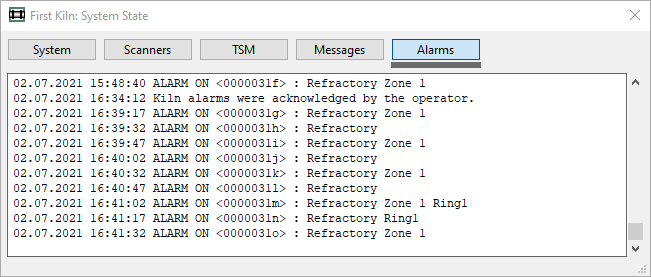
Show the history of alarms (alarms log).