This article guides you through the initial steps of using IRT Cronista. By following the outlined procedures, you'll find it straightforward to generate visually appealing and insightful reports.
For an in-depth understanding of IRT Cronista's extensive capabilities, please refer to subsequent chapters in this manual. They cover a wide range of customizable options for both the content and appearance of your reports.
Before you start
Before diving in, ensure that you've installed the software. If you haven't, please refer to the Installation notes section for guidance.
For those who wish to follow the examples in this article, sample images are provided with the IRT Cronista installation. These samples are typically stored in the Documents folder of the account used to install the software.
Image analysis
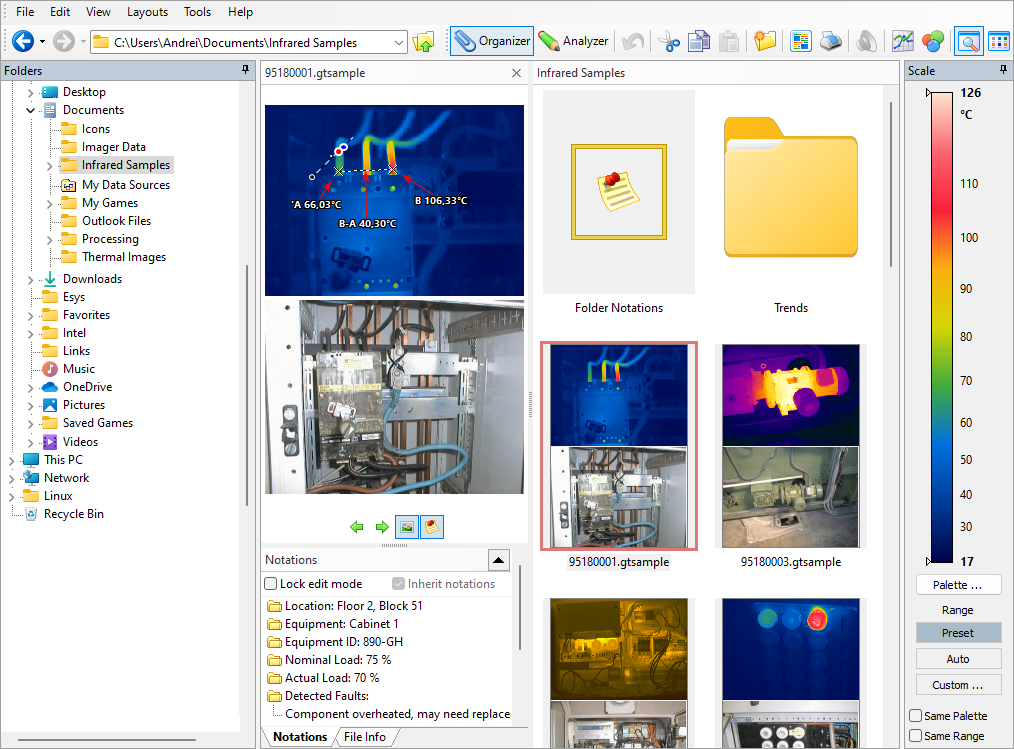
Upon launching IRT Cronista for the first time, a window similar to the one below will appear. The left panel displays a hierarchical view of all disks and folders on your computer.
To locate the sample images:
1.Click the plus or arrow icon next to Documents to expand the folder.
2.Locate and click on the Infrared Samples folder. This will display its contents in the right-hand panel.
3.Select an image to view its details in the central preview window.
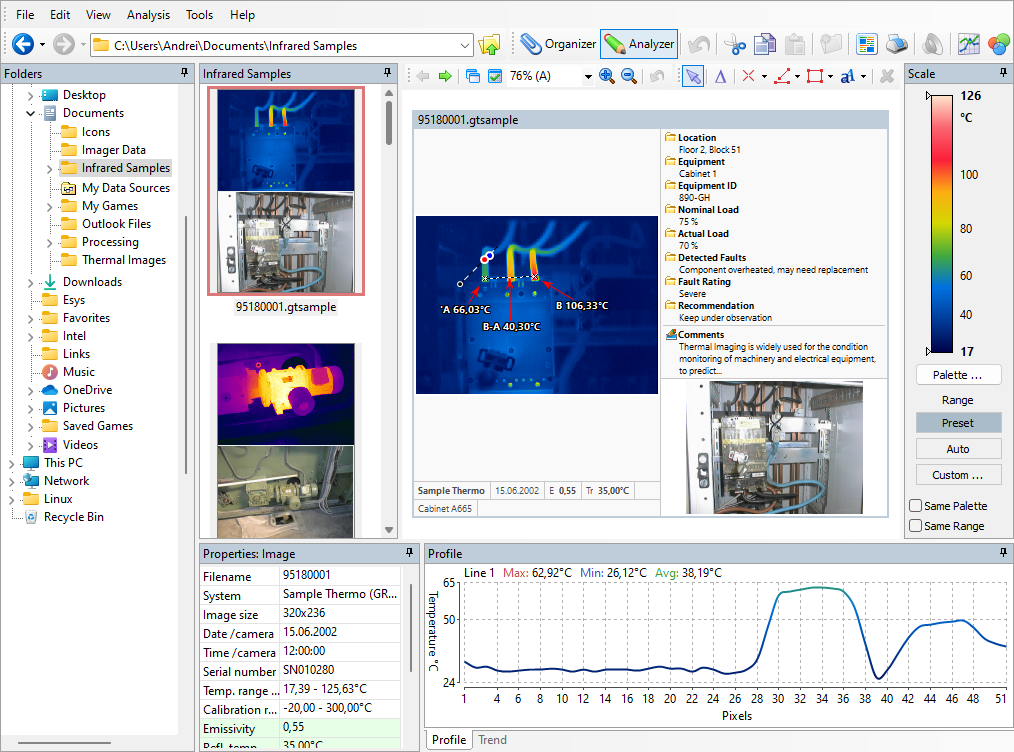
To enable image analysis, activate the Analyzer mode by clicking the corresponding button in the toolbar.

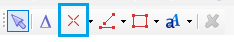
Once Analyzer mode is active, choose a tool from the toolkit and click on the image to create a measurement object, such as the Spot tool.
Making a report using your images
This section walks you through the process of creating a report with your captured images. You will use one of the standard report templates supplied with IRT Cronista, but it is also easy to edit the resulting report (see Editing generated reports for details) or create your own customized templates to include any information you need and to use your own layout and format.
To generate your first report, follow these steps:
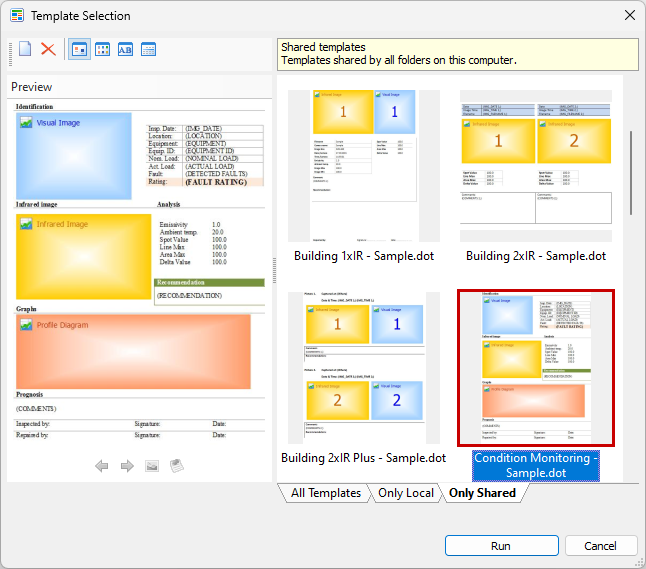
To create a test report: 1.Click the Create Report button
2.Select a template to preview it in the left panel of the dialog. 3.Click Run to populate a Microsoft Word document with your infrared images and related data. Your report is now ready! Open it in Microsoft Word to make any final adjustments before saving. |

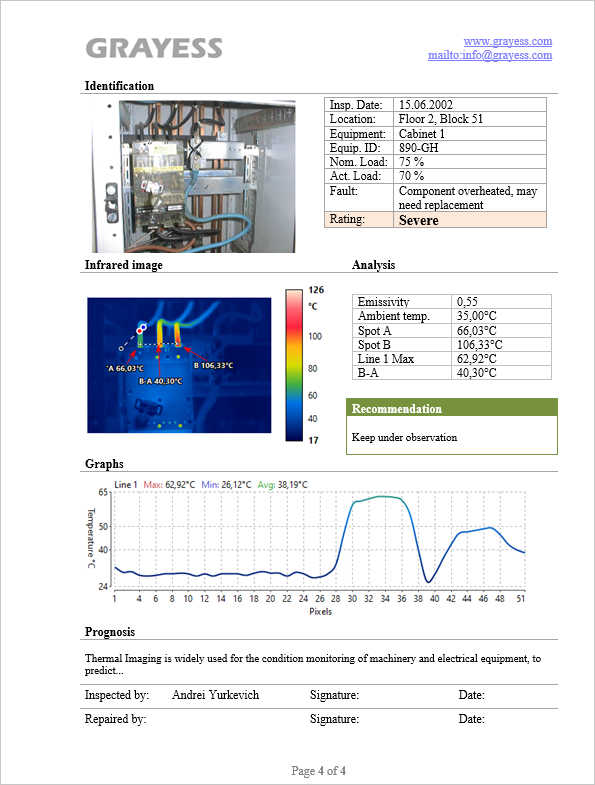
Your final report can include a variety of elements, such as both infrared and visual images marked with your measurements, notes about the object being analyzed, various profiles and histograms, and any other information you deem relevant.