


This method does not require use of report templates. You open a new document in Microsoft Word and edit it just as you edit any other document. IRT Cronista provides images, graphs and data for your document.
Images and data are imported from IRT Cronista with the help of Thermo Reports toolbar. See Thermo Reports toolbar topic for reference.
Infrared image
You should start with putting an infrared image into your document. If infrared image is not present in the document (more precisely - in the current section), you will not be able to import other images and data.
To insert an infrared image to the document, move the caret to the position where you need the image and click on Infrared Image button in the Thermo Reports toolbar. This will add an empty infrared image placeholder to your document.
Now you can fill this placeholder with an actual image. Double click on the placeholder to open IRT Cronista. In IRT Cronista open an infrared image, click Apply to Report button in the Switch to Report toolbar.
This will transfer infrared image with analysis data to your Word document.
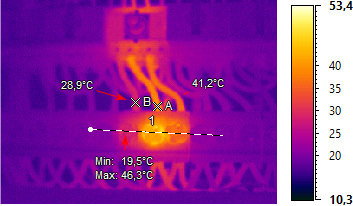
If you double click on a placeholder filled with an infrared image, its contents is opened in IRT Cronista. You can modify the image (like change temperature scale, change analysis objects).
Temperature scale
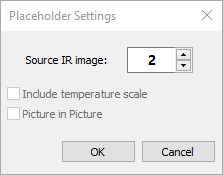
You can select not to show temperature scale on an infrared image drawing. To select this option, click on the infrared image once to make it selected and press Edit in Thermo Reports toolbar. Remove mark from Include temperature scale check box.
Note The source infrared image is not stored inside Word document, only a link to the image on disk is stored. When you double click on an infrared image placeholder IRT Cronista uses the link saved with the placeholder to load the data. This means that if you (or another person) open the document on a computer that does not have access to the original images, it will be not possible to change how the image looks or change its analysis objects. |
Graphs
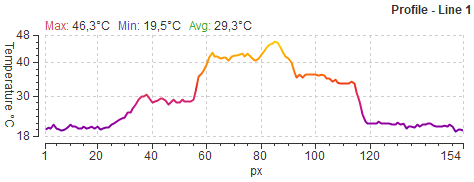
Profile or Histogram
After you inserted an infrared image into your document, you can insert graphs related to this image. Move the caret to the position where you need the graph and click on Profile or Histogram button in Thermo Reports toolbar. Please note that your infrared image should already contain the needed analysis object (a line for profile graph, an area for histogram).
The first graph will display data for the first object. If you insert a second graph, it will take data from the second object, and so on. It is not possible to specify which object should provide data for a graph - graphs select their objects automatically.
To modify graph data you need to change corresponding object in the infrared image. Double click on the infrared image to open it in IRT Cronista and change the object there. |
Visible image
Visible image saved with the infrared image can be inserted in the same manner: use Visual Image button in Thermo Reports toolbar.
Other graphs
IRT Cronista supports several other graph types, for example, trends. There are no individual buttons in Thermo Reports toolbar for each graph, but you can use All Pictures button to show dialog with a list of all supported image placeholder and use any of them.
Fields
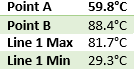
Measurement data, like spot temperature values, and other text data, like image date and time, can also be easily added to your document. Fields are used to show such information. There are standard fields supported by Word, for example page number field, and there are special "thermo" fields handled by IRT Cronista.
To insert a "thermo" field to your document, use Field button in Thermo Reports toolbar (new field will be inserted at the caret position).
Field selection dialog:
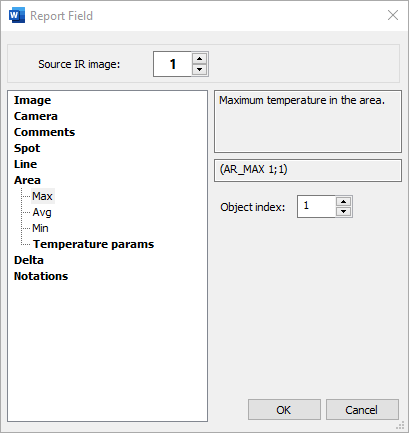
For analysis objects like spots or areas you need to select object index.
When you place the caret in a field placeholder in the document its background becomes gray:  . In other regards it is a normal text, you can change its style (font, color) as you wish.
Changing a field
If you want to modify a field, place the caret in a field and click Edit button in the Thermo Reports toolbar. It, naturally, works only for fields created with Thermo Reports toolbar.
There is 'Edit Field' item in the context menu of a field, you do not need this one. It opens Word's field dialog, it is not useful for "thermo" fields.
Deleting a field
To delete a field created with Thermo Reports toolbar, place the caret in a field you want to delete and click Delete in the Thermo Reports toolbar. You can also delete fields just as you delete any other text with Delete or Backspace keys.
Tables
With fields you can display any text information provided by IRT Cronista. But often there is lot of such information needed in your document. Tables in IRT Cronista reports organize fields into tables. Also tables help when you do not want to care about how many analysis objects there are on the image - when you add or delete an object, corresponding rows will be automatically added or removed from the table.
Use Table button in the Thermo Reports toolbar to create a table. There are three types of tables: Image Info, Analysis Info and Notations. Image Info and Analysis Info tables are similar, the only difference is the preselected rows that are present in the table (and you can change them). Notations table is different, it is automatically filled with all notations saved with an infrared image. See Notations in reports for more details.
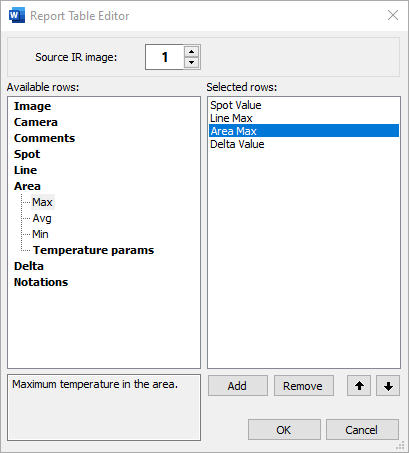
You need to select rows that will be present in the table. Please note that for analysis objects, you do not need to specify object index - if there are more than one object, they all will be added to the table automatically.
Here is how a new table looks like by default:
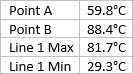
And here is an example of how it can look if formatting is applied:
To format a table you can use everything Word offers. Formatting will not be lost when table is refilled after source image analysis changes. This becomes particularly important when tables are used in templates.
Changing an existing table
If you want to modify an existing table, place the caret in any place of a table and click on Edit button in the Thermo Reports toolbar. It works only for tables created with Thermo Reports toolbar.
Deleting an existing table
To delete a table created with Thermo Reports toolbar, place the caret in any place of a table and click Delete in the Thermo Reports toolbar.
More than one infrared image in a document
You can put many infrared images into your document. Here are some hints how to handle them properly.
Graphs
When there are several infrared images in a document and you want to add a graph, you will obviously need to point to which infrared image your graph belongs. When you add a graph and IRT Cronista report system sees that there are several infrared images, it shows a dialog where you need to specify an index of an infrared image the graph should be linked to.
You can relink a graph to another infrared image afterward: double click on a graph placeholder to show the dialog again.
Fields and tables
With fields and tables it is similar. When you create a field or a table, you can specify index of an infrared image this field or table should be linked to.
Using sections to separate infrared images
When you need many infrared images in your document, not just 2, 3 or 4, the method for linking graphs, fields and tables described above becomes rather cumbersome. This is where sections come to help.
Sections are subdivisions of a document. Once a document is divided into sections, you can make formatting changes that apply only to one section. For instance, you can change the page orientation or the number of columns for just one section. Sections also separate infrared data - you cannot link a graph or a field with infrared images from other sections. Infrared image numbering is reset.
This makes it convenient to put every infrared image into a separate section. Then you do not need to bother with image indexing - all graphs, fields and tables are automatically linked to the infrared image found in the same section.
Section breaks
Sections are separated with section breaks. You can use Word's means to add a section break or the New Section button in the Thermo Reports toolbar. There are section breaks that start a new page - Section Break (Next Page) and sections breaks that does not - Section Break (Continuous). You can use section break type that suits better for you. New Section button in the Thermo Reports toolbar always start a new page.
Duplicate section
Often reporting you need to make for each infrared image is very similar. It is then convenient to do one image, then copy it and then fill it with new data.
There is Duplicate button in the Thermo Reports toolbar that does exactly this. It adds a new section and copies all the data (text, placeholders, fields, tables - everything) from the previous section. Placeholders, fields and tables are emptied so you can select a new infrared image from IRT Cronista to fill them.
By default, Duplicate adds section breaks that start new pages. You can change this in the settings - click on Settings button in the Thermo Reports toolbar and select "Several sections per page" option.
Summary table
Not available in the Standard Edition
Summary table is a table of fields taken not just from one infrared image but from all images in the document. It is kind of table of contents for reports. Each row of a summary table represents one infrared image section (and each image section can contain one or more infrared images). Columns can be any data available for the fields.
To create a summary table: 1.Add several infrared images to your document, so the new summary table is not empty. 2.Move the caret to a place where you want to insert a new summary table and click Summary Table button in the Thermo Reports toolbar. 3.Select necessary categories in the Summary Table Editor, press OK. 4.Use Microsoft Word features to format your table, for instance, use tools in Table Design and Layout tabs. |
Summary Table Editor is very similar to the normal fields table editor. In the left part of the dialog there is a list of all available fields grouped under several categories.
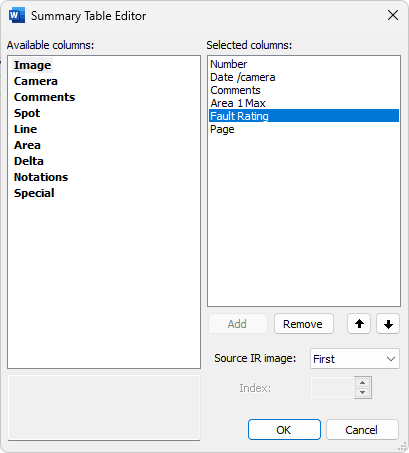
The list of fields is the same as in the fields editor with the exception of Special category that contains two fields:
·Number: index of the infrared image in the report (same as the row number in the summary table);
·Page Number: page number of the page that contains corresponding infrared image .
You can have as many columns in the summary table as you can fit on your document page. To add a column, click on it and push Add button. It will appear in the right part of the dialog which contains the list of selected columns (fields). To remove a field from the list, click on it in the right part of the dialog and push Remove button. You can also add and remove fields by double clicking on them.
To define columns ordering use buttons with Up and Down arrows.
In summary tables each column can have its own Source IR image. This property is used when the IR sections in your report contain more than one infrared image, to choose which image to use as the data source. You can get data from the First and Last image in a section. If a section contains more than two images, data from the images between the first and the last cannot be addressed.
The table will be added to the document at the caret position. For templates, summary table is not allowed to be in the same section together with infrared image placeholder, if you select such insertion place, a new section will be added and summary table will be created there.
Below is an example of how a summary table might look like.
