


To perform thermal measurements, open an infrared image in the Analyzer mode. To switch to the analyzer mode, double-click the infrared image or click the corresponding button in the toolbar:

In the picture below you see the structure of the application in the Analyzer mode.
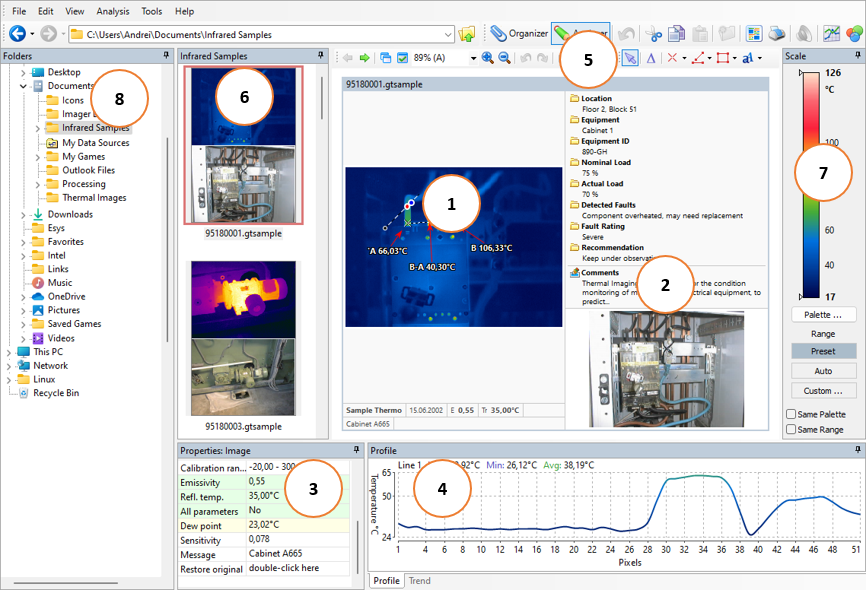
1.Active image with analysis objects.
2.Measurement Details concerning the active image (notations, comments, linked visual image).
3.Properties of the active object or properties of the image.
4.Diagrams: line profiles, area histograms, trends.
5.Toolbar with all measurement tools.
6.Image Thumbnails: all infrared images in the folder.
7.Temperature scale and palette.
8.Folders.
Many elements and windows are similar to those in the Organizer mode. For instance, you can find here the Temperature Scale window, the Folders window, the main menu, the toolbar and the address bar - all the same as in the Organizer mode.
Analysis window
The central part of the screen is occupied by the analyzed infrared image. The analyzed infrared image is accompanied by Measurement Details (notations, comments and visual image) and Analysis Details (properties and diagrams).
If there is no visual image, that means it was not linked to the infrared image (see the chapter Linking visual images to infrared for details). If there is no comments and notations, see the chapter Notations to know how to create them.
You may need to hide analysis and measurement details in order to enlarge the analysis space. To hide or show these elements, use View | Windows menu or the context menu of the analysis window.
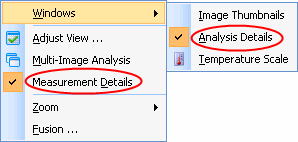
Image thumbnails
To the right of the folders window is the image thumbnails window. This is a filmstrip of images in the active folder (the one selected in the folder tree). To show or hide this window, place or remove a check mark against Image Thumbnails in View | Windows menu.
Temperature scale
The temperature scale window (situated in right-hand part of the screen) shows the temperature range selected for displaying it against the color palette. It gives the correspondence between temperatures and colors used to represent them. The functionality of the temperature scale window in the Analyzer mode is the same as in the Organizer mode. So, see Temperature scale and palettes topic above. To show or hide this window, in the menu choose View | Windows | Temperature Scale.
Folders
The folders window is situated in the left-hand part of the screen. It shows the content of all catalogs and folders on your computer and the network. Here you can go to a folder with your infrared images that you want to analyze. To show or hide this window, choose View | Folders or press CTRL+F.