


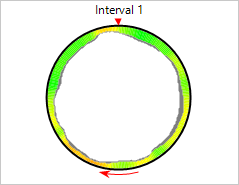
Thickness / Coating diagram is placed at the right bottom corner of the screen. It displays the worst case diagram with minimum brick thickness and maximum coating thickness along the selected kiln area. It also shows the kiln trigger position and the rotation direction.
Depending on the active kiln view the data in the diagram refers to:
·the whole kiln,
·selected area or
·slice / section position.
When the Temperature map 2D view is selected, thickness diagram displays brick and coating data for the whole kiln. But if there are interval or slice analysis objects on the image and one of them is selected at the moment, thickness diagram displays data for the selected interval or slice.
Overall kiln data is also presented for the Virtual kiln 3D view. When the Kiln section 3D or the Kiln end-view are active, the diagram refers to the section position.